In comparison to previous years, the majority of people now choose digital marketing. Digital marketing is a digital channel that aids in the promotion of our company’s brand, products, and services. In recent years, this approach has sparked fierce competition in a variety of industries. This case demonstrates the need of tracking customer behaviour toward a product in order to maintain a brand’s niche dominance.
Are you perplexed as to how this is possible? Google Analytics, on the other hand, may provide you with all of the precise reports about the visitors to a specific website. Take a peek at the Audience Report in Google Analytics.
Read more about Google Analytics in our post What Is Google Analytics?
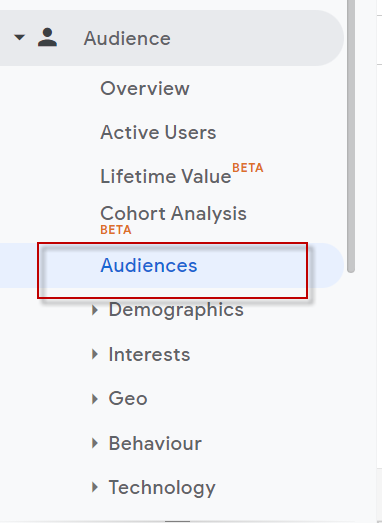
Audience Report

Google Analytics’ audience reports aid in the comprehension of user perceptions. Active users, Lifetime value, Cohort Analysis, Audiences, User Explorer, Demographics, Interests, Geo, Behavior, Technology, Mobile, Cross-Device, Custom, Benchmarking, and Users Flow are all components of audience reports. All of these pieces together provide a comprehensive picture of the websites and enable you to do a comparative analysis of the projects.
Overview
The audience reports’ overview delivers the most important information in a single glance. Users, new users, page views, sessions, average sessions, bounce rate, and many other metrics are displayed in the overview report. The date range is set to week by default, however the calendar drop-down menu can be changed to month view (as per your analysis requirements). On an hour-by-hour, day-by-day, week-by-week, and month-by-month basis, the overview data can be examined.
Active Users

This report shows how many new users visited your website in each of the following time periods: 1 day, 7 days, 14 days, and 28 days. This is the most important report since it explains marketing effectiveness. If the number of users on day one is large, but the number falls short of expectations in the long run, it indicates that proper decisions must be made in order to maintain long-term user involvement.
Lifetime Value

Marketers can utilise the lifetime value (LTV) to identify which campaigns are successful and which new approaches can be implemented to get more customers back to the website. Paid search, social media, organic search, affiliate marketing, and a variety of other channels could all be used to achieve these goals. LTV is a metric that shows how much data consumers have obtained in the last day, week, or month. Pageviews Per User, Sessions Per User, Sessions Duration Per User, Transaction Per User, Goal Completion Per User, and Revenue Per User are some of the KPIs that make up LTV.
Cohort Analysis

Before you can grasp cohort analysis, you must first understand what the term “cohort” means. A ‘cohort’ is a group of people who share the user’s attributes and behaviour. In Google Analytics, the ‘Acquisition Date’ determines the cohort analysis. It’s divided into four major sections:
Cohort Type

This determines which cohort should be relied upon. The default choice for this in Google Analytics is ‘acquisition date.’
Cohort Size –
This gives data on a daily, weekly, and monthly basis, accordingly.
Metric –
The actual data is represented as user retention, which is based on various aggregated statistics such as goal completion per user, pageviews per user, revenue per user, and so on.
Date Range –
This report can be analysed using a date range of the last 7 days, 14 days, 21 days, or 30 days.

Audiences
Audiences in analytics reports are groups of users with similar behaviours and interests who can assist you with your business. Any of the buyers or shoppers could be included in this group. Users who have viewed 0 products are included, but those who have made 0 transactions are excluded. You can customise the data to meet your own requirements. Consider the following scenario: Which user bought something inside a month or a year?
User Explorer
You must first enable the user-ID functionality in your properties in order to read this report. You may examine the statistics for each client with the initial data such as Sessions, Average Sessions, Revenue, Bounce Rate, Transaction, and Goal Conversion Rate when you set up the ID. By using this report to analyse user behaviour, you may tailor customer service and product specifications to their preferences.
Demographics

The Demographics section of Google Analytics is the most important element of the report since it helps you understand the characteristics and behaviour of the users who visit your website. Age and gender are the two main categories for demographics.
The demographics overview section displays the overall age and gender data. 18-24 years old, 25-34 years old, 35-44 years old, 45-54 years old, 55-64 years old, and 65 years old are the age groups.
Gender is separated into two categories: Male and Female. The age and gender report provides specific information about the user’s behaviour based on their age. The data covers average sessions, bounce rate, and session duration, among other things.
Interests

The most useful information can be found in Google Analytics’ interest reports. Affinity, in-market sectors, and other categories are the three types of interest reports.
The most useful information can be found in Google Analytics’ interest reports. Affinity, in-market sectors, and other categories are the three types of interest reports.
Geo

The Geo report displays the website’s language and location. The Language section displays information on language acquisition, behaviour, and conversions for users who prefer other languages. If you manage an international business or plan to do so in the near future, this study is a must-read. Users from various countries, cities, continents, and subcontinents can be found in the location section. The study of this location report will assist you in determining whether marketing efforts were made in the appropriate area and manner. The location metric also includes a map representation.
Behaviour

The user’s actions on the site are displayed in the Google analytics behaviour report. New vs. Returning users, Frequency & Recency, and Engagement are among the data included in the behaviour report. This report provides information on how long a user stays on your website, how frequently new visitors visit the site, and how many pages the user views.
Technology

The technology report in Google Analytics shows information about the browsers that users use to access your website. This information is useful if you want to build an application or add an extension to the browser and want to see if it’s compatible. The report displays sessions, users, new users, and other data from various browsers. In the major dimension measurements of the technology report, one may also examine the operating system, screen resolution, screen colours, flash version, and many other things.
Mobile

The mobile report displays the devices that your visitors used to access your website. This mobile report’s overview section provides an overview of the device categories. The report depicts mobile, desktop, and tablet acquisition, behaviour, and conversion. It also exposes details about the devices that the user uses to access the website. If you’re working on a mobile app for an operating system like Android or Apple, this study is a must-read.
Custom
The reports that you generate in Google Analytics are known as custom reports. When creating a custom report, you can choose any metrics you like, such as sessions, page visits, bounce rate, and so on. This is a more comprehensive report. When creating custom reports, one dimension and one metric are required.
Users Flow

This is a one-of-a-kind Google Analytics report. It depicts the user’s journey through the entire website. It aids you in gaining a comprehensive understanding of audience behaviour by allowing you to see which pages are losing interest or becoming stuck. You can select the country, city, network domain, operating system, and other options from the drop-down in the top left corner, and the data will be delivered accordingly.
Our SEO experts use Google Analytics to gather important data about your company, and we use it for a variety of SEO services. How do you keep track of your achievements? Leave your responses in the comments section below!